The Storyboard Lua Debugger enables the developer to monitor the flow of execution of the Lua scripts used by the Storyboard application. Using the debugger it is possible to step line by line through a Lua script while examining the variable values that are being used by the Lua functions.
Note
The Lua debugger is configured such that it can only be used with the simulator runtimes on the host platforms that support Storyboard Designer. For assistance in configuring the debugger for embedded targets, contact Crank Software support (support@cranksoftware.com).
The Storyboard Lua debugger is only available with Storyboard Suite versions 1.1 and newer.
The Designer debugging environment communicates with the application's Lua script plugin using network sockets in a client/server model. The Storyboard application acts as the client and is controlled by the Designer debug environment which acts as the server.
In order to configure the client and server, the following steps must be taken:
Create a Storyboard application launch configuration
Include the Storyboard Lua plugin and enable debugging
Create a Lua debug launch configuration
Launch the Storyboard application
Launch the Lua debug session
The first three steps are part of a one time configuration required to set-up the application and the debugger. After the initial set-up, only the last two steps need be performed in order to launch and run the debugger.
A Storyboard Launch configuration is automatically created when a Storyboard application is simulated via Run > Simulate Storyboard Project or by right clicking on the GDE file and selecting Storybord Simulator.
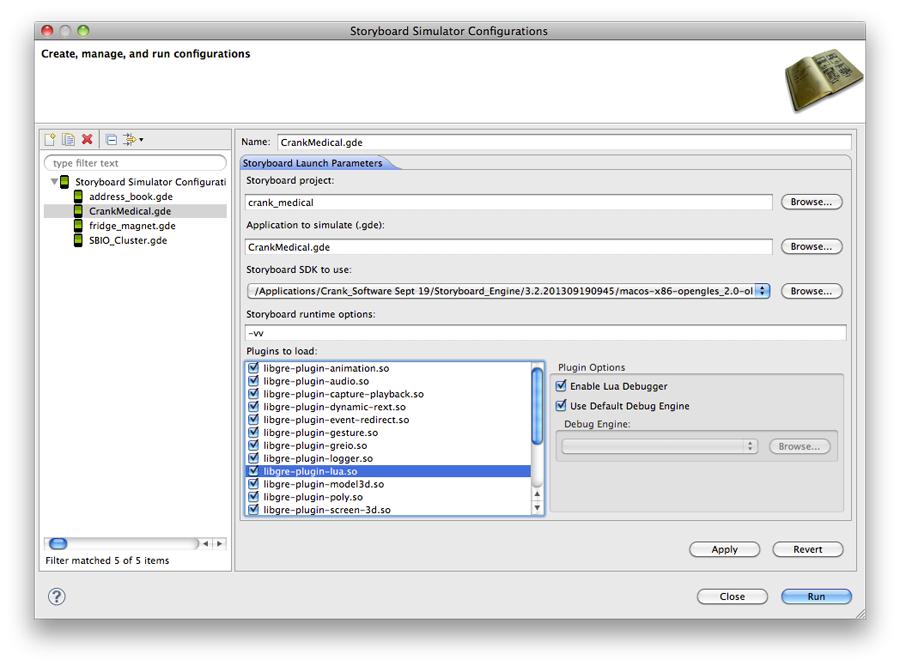
In order to create a new launch configuration, or to customize an existing one, then we need to open the Launch Configuration dialog. This can be done by selecting Run > Storyboard Simulator Configurations > Storyboard Simulator Configurations from the main menu. This will open a dialog where one can create, duplicate or delete simulator launch configurations
From the launch configuration dialog select the configuration that is to be used for the debug session. In the plugin listing ensure that the Lua plugin is selected and that the Enable Lua Debugger option has been selected.
Similar to the Storyboard launch configuration, it is necessary to create a specific launch configuration for the Lua debug server. This is accomplished similarly to creating a Storyboard launch configuration, but is done in the Debug Perspective.
Switch to the Debug Perspective, using Window > Open Perspective > Debug.
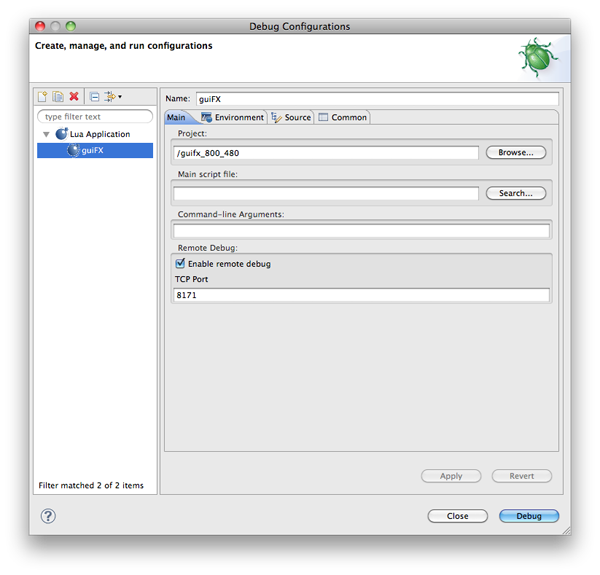
Open the debug launch configurations Run > Debug Configurations ...
Create a new Lua debug launch configuration Lua Application > New
Select the Storyboard project you wish to debug and select Enable remote debug
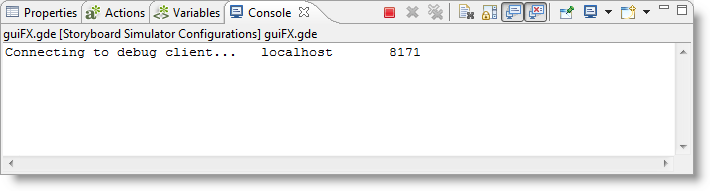
With the Storyboard launch configuration created and the Lua plugin and debug mode enabled, you can now run the Storyboard application Run > Storyboard Simulator Configurations ... > [Your Config].
The application should start, but before anything is displayed a message should be generated on the console indicating that it is waiting for the Lua debug server to connect.
 |
The Lua debugger works like a traditional debugger. The Debugger perspective provides an alternative layout of views related to debugging activities.
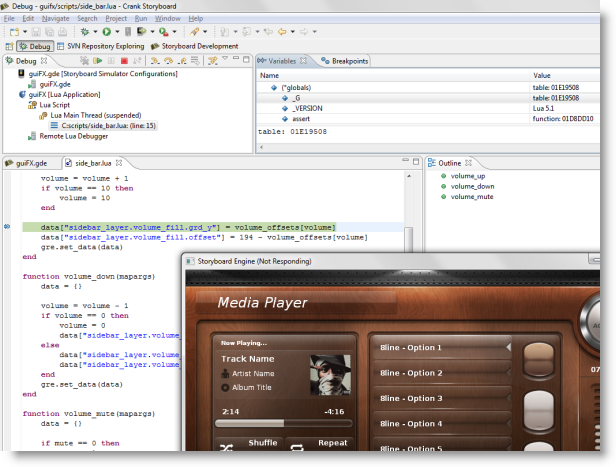
Breakpoints are listed in the Breakpoints view, local variables that are in scope for the selected frame are show in the Variables view. The current stack trace and execution control (step, continue) are provided in the Debug view.
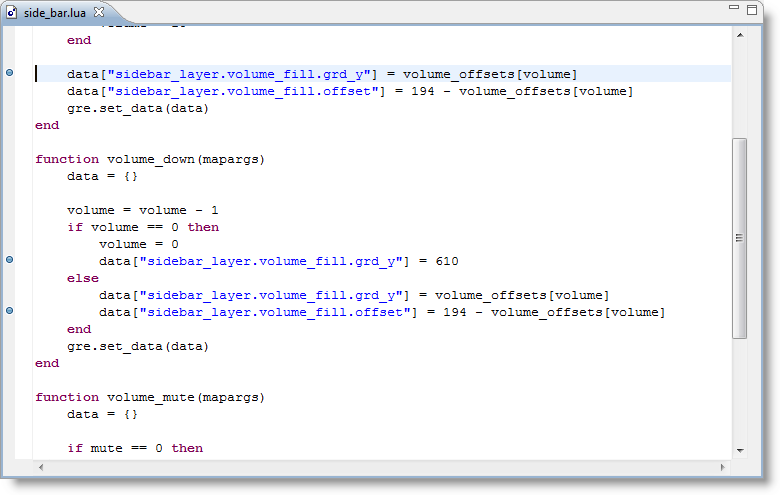
Breakpoints can be placed directly in the editor for Lua script files. Breakpoints can be toggled on/off by double clicking in the margins of the Lua script file where the execution should be stopped. While it is possible to place breakpoints on all lines of a Lua script file, not all lines are breakable due to the manner in which the Lua script is executed. Declaration breakpoints may not resolve to an execution stop point in the script.
Breakpoints can also be enabled and disabled and removed by selecting them from the listing in the Breakpoints view and performing the appropriate operation. It is also possible to navigate to directly to the script source file from withing the Breakpoints view by right clicking and selecting Go To File.
 |
Variables are displayed in a hierarchical manner in the Variables
view. Global variables are displayed in a special table and listed as
globals while function parameters and local variables
are displayed as top level elements. Strings and numeric values are
displayed directly, while tables can be navigated by double clicking
their nodes and driving down.
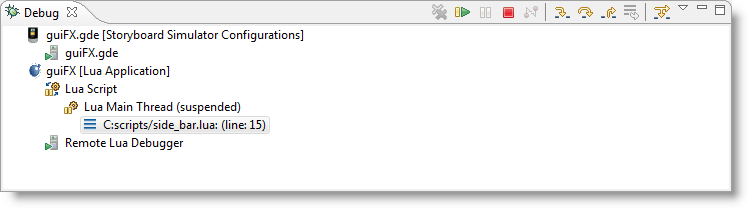
The Debug view provides a list of active debug sessions and the execution stack trace when a session is at a breakpoint. Once a breakpoint is hit, then it is possible to single step to the next line of code, to continue the execution until the next breakpoint is encountered or to terminate the application all together using the view's toolbar commands.
 |