Metrics View
The Metrics view shows how much memory and storage is going to be used by the resources that are included in a Storyboard application. Resources account for a large majority of the memory and storage cost ascociated with a Storyboard application. If a Storyboard application needs to reduce its memory and storage costs, then its resource use is an area that should be investigated to see if there are sections of the application that can be redefined to reduce the use of resources and therefore save on the memory and storage costs
The memory and storage cost of a resource is affected by how it is stored. In the case of a storing resouces on a conventional filessytem, images are decompressed in to memory and font glyphs are managed by the freetype font engine in a cache. In the case where a virtual filesystem is being used, there are options to control how images and fonts are stored and accessed and this will have an impact on how much memory and storage they will consume. The configuration combo box allows you to select the resource export configuration to show the memory and storage costs for. The edit button next to the configuration combo box will open the Resource Export Configuration editor, which allows for creating new configurations that can have different settings applied to individual resources. For more information on the Resource Export Configuration dialog, see the section in this document.
The model cost for a Storyboard application is tied to the runtime that is being used. Different runtimes will have different model costs due to the differences in internal storage types used in the runtimes. Selecting different runtimes will show how much the model will cost while the engine is running with the Storyboard application.
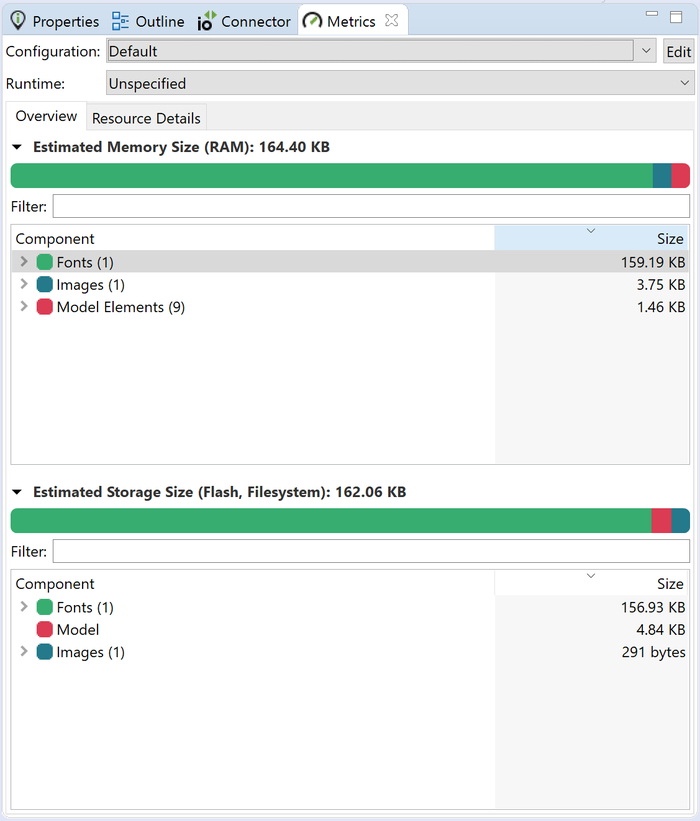
The outline section in the Metrics view shows the breakdown of the memory and the storage taken up by each type of resource, which are images, fonts, scripts, and other. These sections can be expanded to show each individual resource. A resource can be selected and a menu that is invoked by right-clicking on the resource will allow for searching of the model to show which model elements are referencing that resource. There is also the option to view what an image looks like to provide context, as well as the option to edit the resource in the currently selected resource export configuraiton. The filter text field can be used to search for a resource by name.
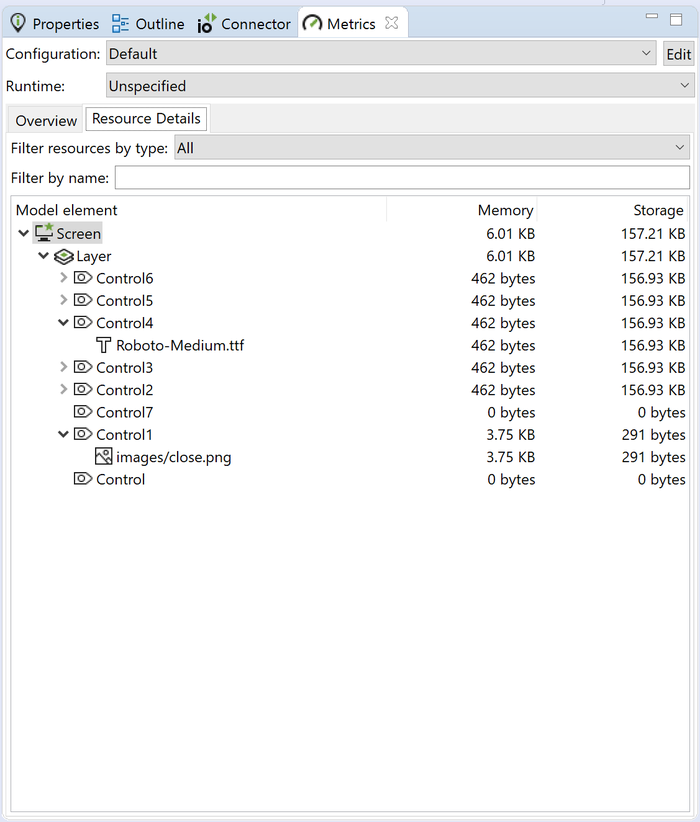
The resource details tab shows a break down of resources being used by each element in the Storyboard application. The element can be selected and show in the application view by selecting that option from the right click menu. This tab is useful for seeing which elements in the Storyboard application are taking up the most memory and storage. The filter by name text field can be used to search for an element by name.
It should be noted that this is just the memory cost for resources. Things like circles, polgyons, complex screen transitions, and code that is written in Lua will have a memory cost ascociated with it. For example, complex screen transitions will need to composite the current screen and the next screen in to offscreen memory buffers. This would cost an addition width * height * bit depth * 2 in memory usage to perform that complex screen transition.