The Storyboard Lua Debugger enables the developer to monitor the flow of execution of the Lua scripts used by the Storyboard application. Using the debugger it is possible to step line by line through a Lua script while examining the variable values that are being used by the Lua functions.
Note
The Lua debugger is configured such that it can only be used with the simulator runtimes on the host platforms that support Storyboard Designer. For assistance in configuring the debugger for embedded targets, contact Crank Software support (support@cranksoftware.com).
The Designer debugging environment communicates with the application's Lua script plugin using network sockets in a client/server model. The Storyboard application acts as the client and is controlled by the Designer debug environment which acts as the server.
Creating and launching the debug server is an automated process. To configure Lua debugging it suffices to take the following steps:
Create a Storyboard application launch configuration. This topic is discussed in more detail in the chapter Chapter 10, Simulating your Application.
Enable debugging in the Storyboard Lua plugin
Launch the Storyboard application
The first two steps are part of a one-time configuration required to set-up the simulator launch configuration. After the initial set-up, only the last step needs to be performed in order to launch an application with the Lua debugger running.
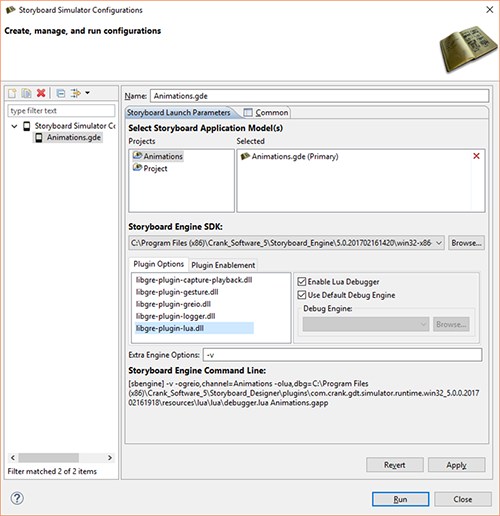
When enabling the Lua debugger you may find it convenient to create a second launch configuration for the same project with debug enabled. This will allow you to quickly switch from a development/debug simulation to a standard simulation. To enable the Lua debugger simply check the Enable Lua Debugger option associated with the Lua plugin options.
Once the Lua debugger is enabled, run the Storyboard application the same as you would a normal simulation.
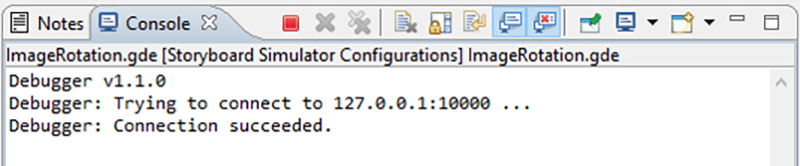
This will launch the Storyboard application and at the same time initialize the debug client within the Storyboard application and the server running within the Designer environment. The two will connect automatically over a network socket and your application should immediately begin running. To confirm that the connection has taken place and the Lua debugger is running, check the output console for the following:
If you change to the Debugger perspective, the Debug view should look like this:
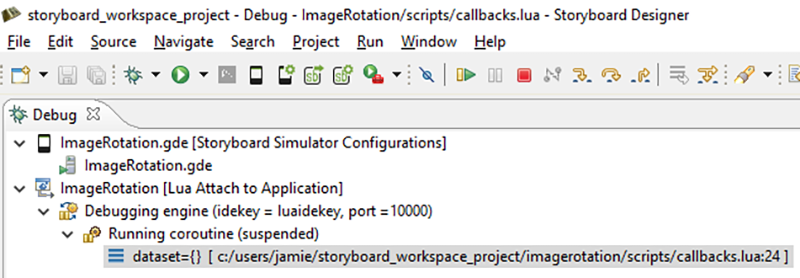
You are now able to start debugging your Lua code
The Lua debugger, when a breakpoint is activated will automatically switch to the . This perspective provides an alternative layout of views that are specifically related to debugging activities.
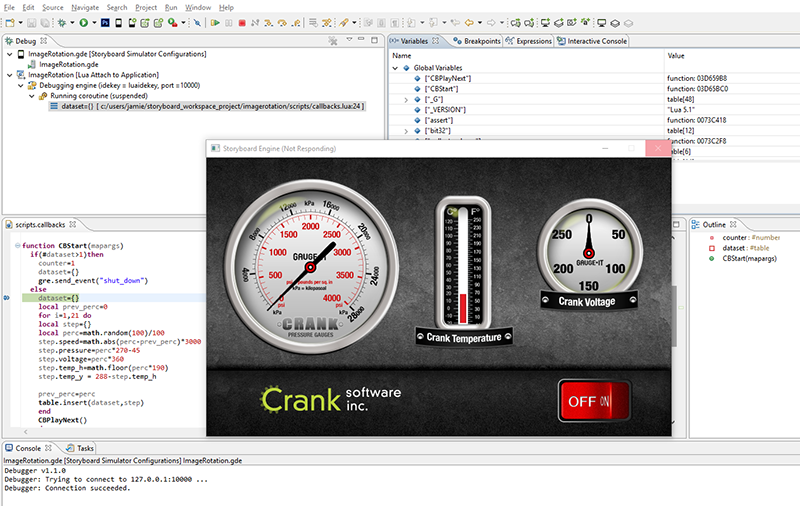
- Variables
Variables are displayed in a hierarchical manner in the Variables view. Global variables are displayed in a special table and listed as
globalswhile function parameters and local variables are displayed as top level elements. Strings and numeric values are displayed directly, while tables can be navigated by double clicking their nodes and driving down.- Breakpoints
Breakpoints can be placed directly in the editor for Lua script files. Breakpoints can be toggled on/off by double clicking in the margins of the Lua script file where the execution should be stopped. While it is possible to place breakpoints on all lines of a Lua script file, not all lines are breakable due to the manner in which the Lua script is executed. Declaration breakpoints may not resolve to an execution stop point in the script.
Breakpoints can also be enabled and disabled and removed by selecting them from the listing in the Breakpoints view and performing the appropriate operation. It is also possible to navigate to directly to the script source file from withing the Breakpoints view by right clicking and selecting Go To File.
- Stepping, Continuing and Terminating
The Debug view provides a list of active debug sessions and the execution stack trace when a session is at a breakpoint. Once a breakpoint is hit, then it is possible to single step to the next line of code, to continue the execution until the next breakpoint is encountered or to terminate the application using the view's toolbar commands.
If the Lua debugger is not working, there may be some of the following messages printed in the console view:
DEBUGGER WARNING lost debugger connection
PANIC: unprotected error in call to Lua API (...resources
\lua\lua\debugger.lua:3237: Cannot connect to 127.0.0.1:10000
: connection refused)
The first thing to check when the connection fails is the port number that the connection is happening on. The debug client shipped with Storyboard will look on port 10000, however Storyboard does not control what port the debug server listens on. To check what port the debug server is listening on, after launching Storyboard navigate to the Debug perspective as above and check the Debug view for the connection details.
If the port number is anything other than 10000, then the debug client has to be modified to search on that port. There are two ways to do this. One is to set the environment variable 'DBGP_IDEPORT' to the port number you want. The presence of that environment variable will override the default value used by the client. Alternatively, the debug client can be modified directly to change the default port number. The debug client can be found in the installation in the following path:
- Windows
installation_directory/Storyboard_Designer/plugins/com.crank.gdt.simulator.runtime.win32_version/resources/lua/lua/debugger.lua- MacOSX
installation_directory/Storyboard_Designer/Storyboard.app/Contents/Eclipse/plugins/com.crank.gdt.simulator.runtime.macosx_version/resources/lua/lua/debugger.lua- Linux
installation_directory/Storyboard_Designer/plugins/com.crank.gdt.simulator.runtime.linux_version/resources/lua/lua/debugger.lua
The port number used is specified on line 3200. If you are going to
do this, it is recommended that you copy debugger.lua from the
installation onto your local system rather than modify the installation directly.
Your modified local version can then be passed into the plugin options as a custom
debug engine in the .